[Day 2] Log analysis O Data, All Ye Faithful
Day 2
This is about using python to analyze data.
Theory - Data science 101
| Role | Description | |—————————————–|—————————————————————————————————————————————————————————————————————————————————————————————————————————————| | Data Collection | This phase involves collecting the raw data. This could be a list of recent transactions, for example. | | Data Processing | This phase involves turning the raw data that was previously collected into a standard format the analyst can work with. This phase can be quite the time-sink! | | Data Mining (Clustering/Classification) | This phase involves creating relationships between the data, finding patterns and correlations that can start to provide some insight. Think of it like chipping away at a big stone, discovering more and more as you chip away. | | Analysis (Exploratory/Confirmatory) | This phase is where the bulk of the analysis takes place. Here, the data is explored to provide answers to questions and some future projections. For example, an e-commerce store can use data science to understand the latest and most popular products to sell, as well as create a prediction for the busiest times of the year. | | Communication (Visualisation) | This phase is extremely important. Even if you have the answers to the Universe, no one will understand you if you can’t present them clearly. Data can be visualised as charts, tables, maps, etc. |
Solution
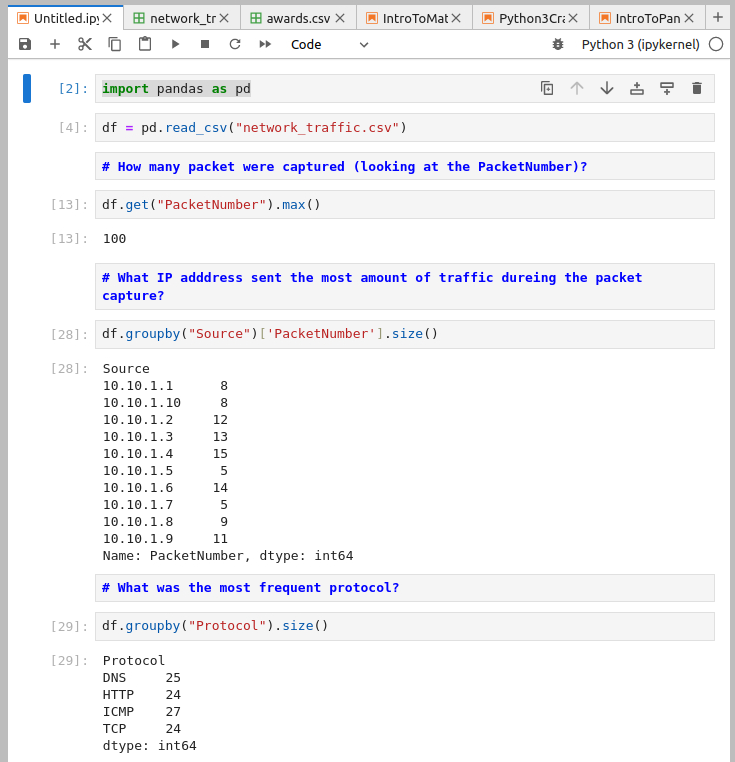
I wrote this python file to extract the answers from network_traffic.csv:
| PacketNumber | Timestamp | Source | Destination | Protocol | |————–|———–|————|————-|———-| | 1 | 05:49.5 | 10.10.1.7 | 10.10.1.9 | HTTP | | 2 | 05:50.3 | 10.10.1.10 | 10.10.1.3 | TCP | …